Knotoids
The mathematical concept of knotoids opens possibilities to topologically characterize diagrams resulting from projections of open-ended 3D curves like, for example, curves determined by Cα of protein chains. The topology of the knotoid diagram is maintained under Reidemeister moves (see e.g. [3]) that do not involve endpoints of a diagram. Moreover, the endpoints are not allowed to cross any of the arcs of the diagram. There are planar and spherical knotoids resulting from projection of open-ended 3D curve on the plane or on a sphere, respectively. Spherical knotoids have additional degree of freedom compared to planar knotoids and therefore there are examples of pairs of diagrams that form nonequivalent knotoids on a plane, but which become equivalent when they are considered on a sphere. For this reason, planar knotoids provide more detailed information about the underlying structure of a 3D curve when compared to spherical knotoids.
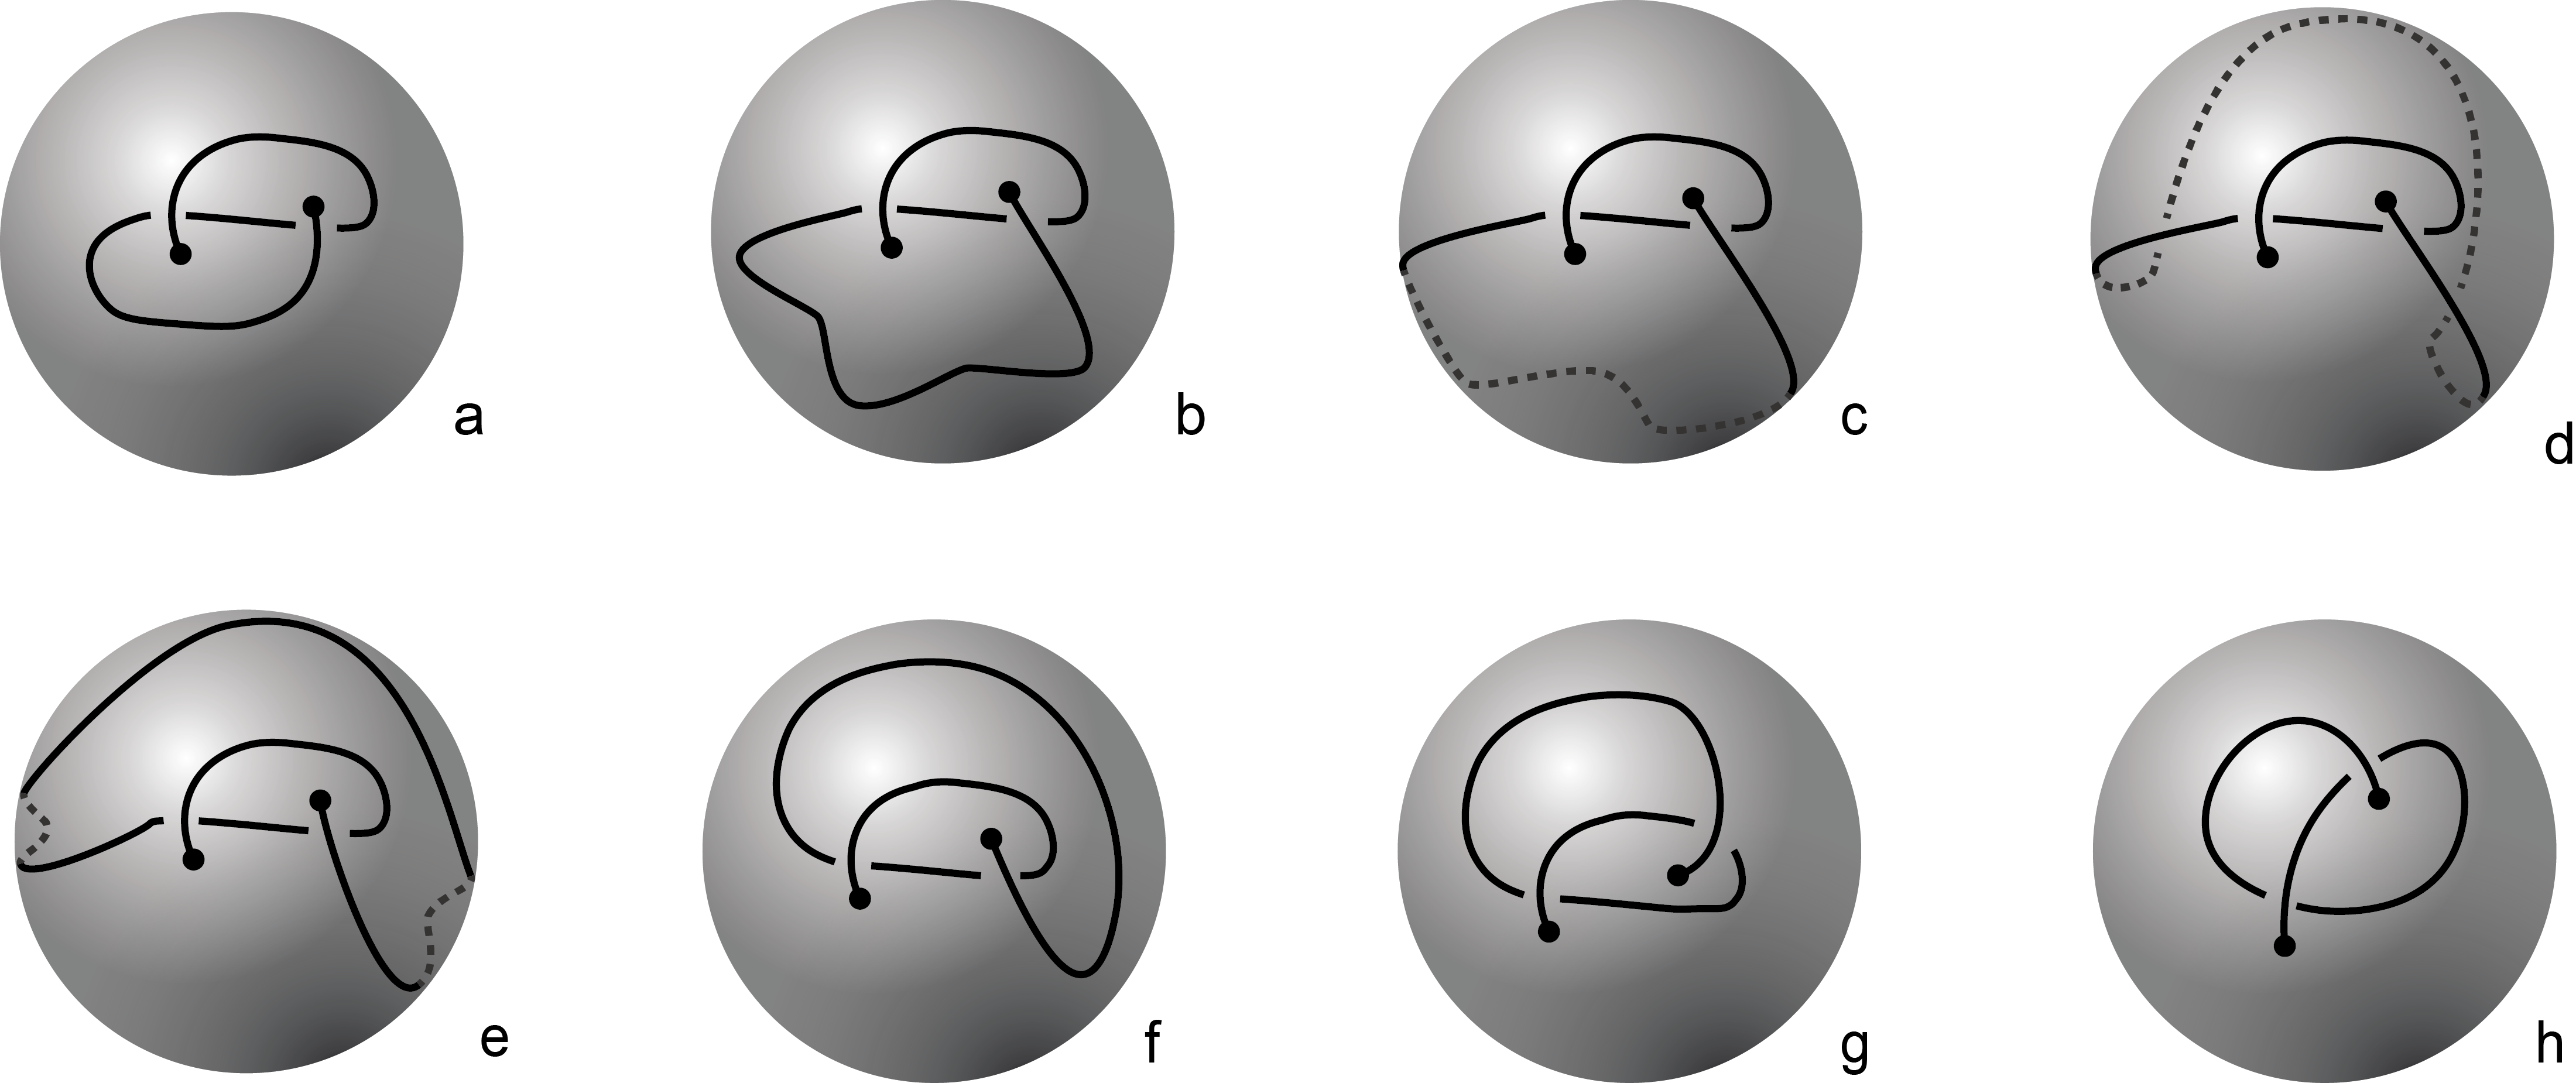
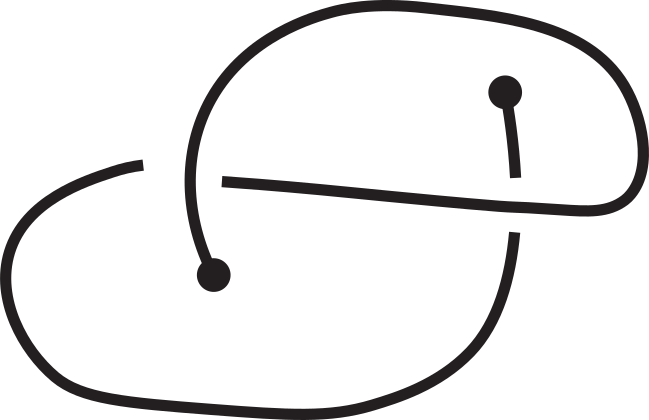
Fig 1. Knotoids in panels (a) and (h) are not equivalent when considered on the plane.
However, they become equivalent when considered on the sphere.
The sequence from panel (a) to panel (h) shows the steps of the transformation.
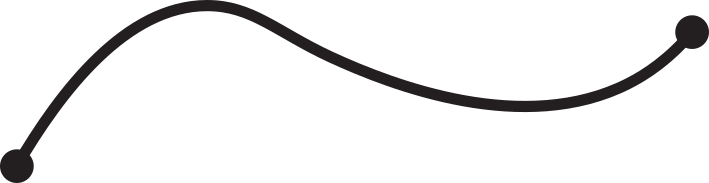
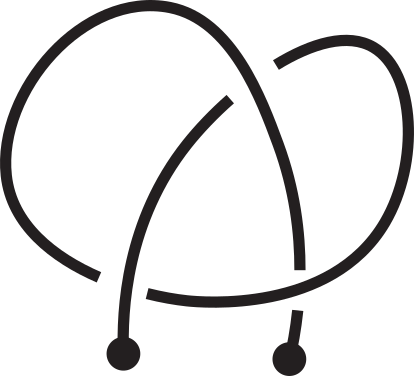
Knotoids allow the characterization of topology of open chains without requiring the endpoints to be connected in order to form a closed loop. From a given open chain one can obtain a knotoid diagram in the following way. Choose a projection plane for the curve and introduce two infinite lines through the endpoints that are perpendicular to the projection plane. These lines fix the endpoints of the resulting diagram region-wise. The chain’s shadow on the projection plane is considered together with the information of overpassing/underpassing arcs at each crossing in order to obtain a knotoid diagram (see Fig.2).
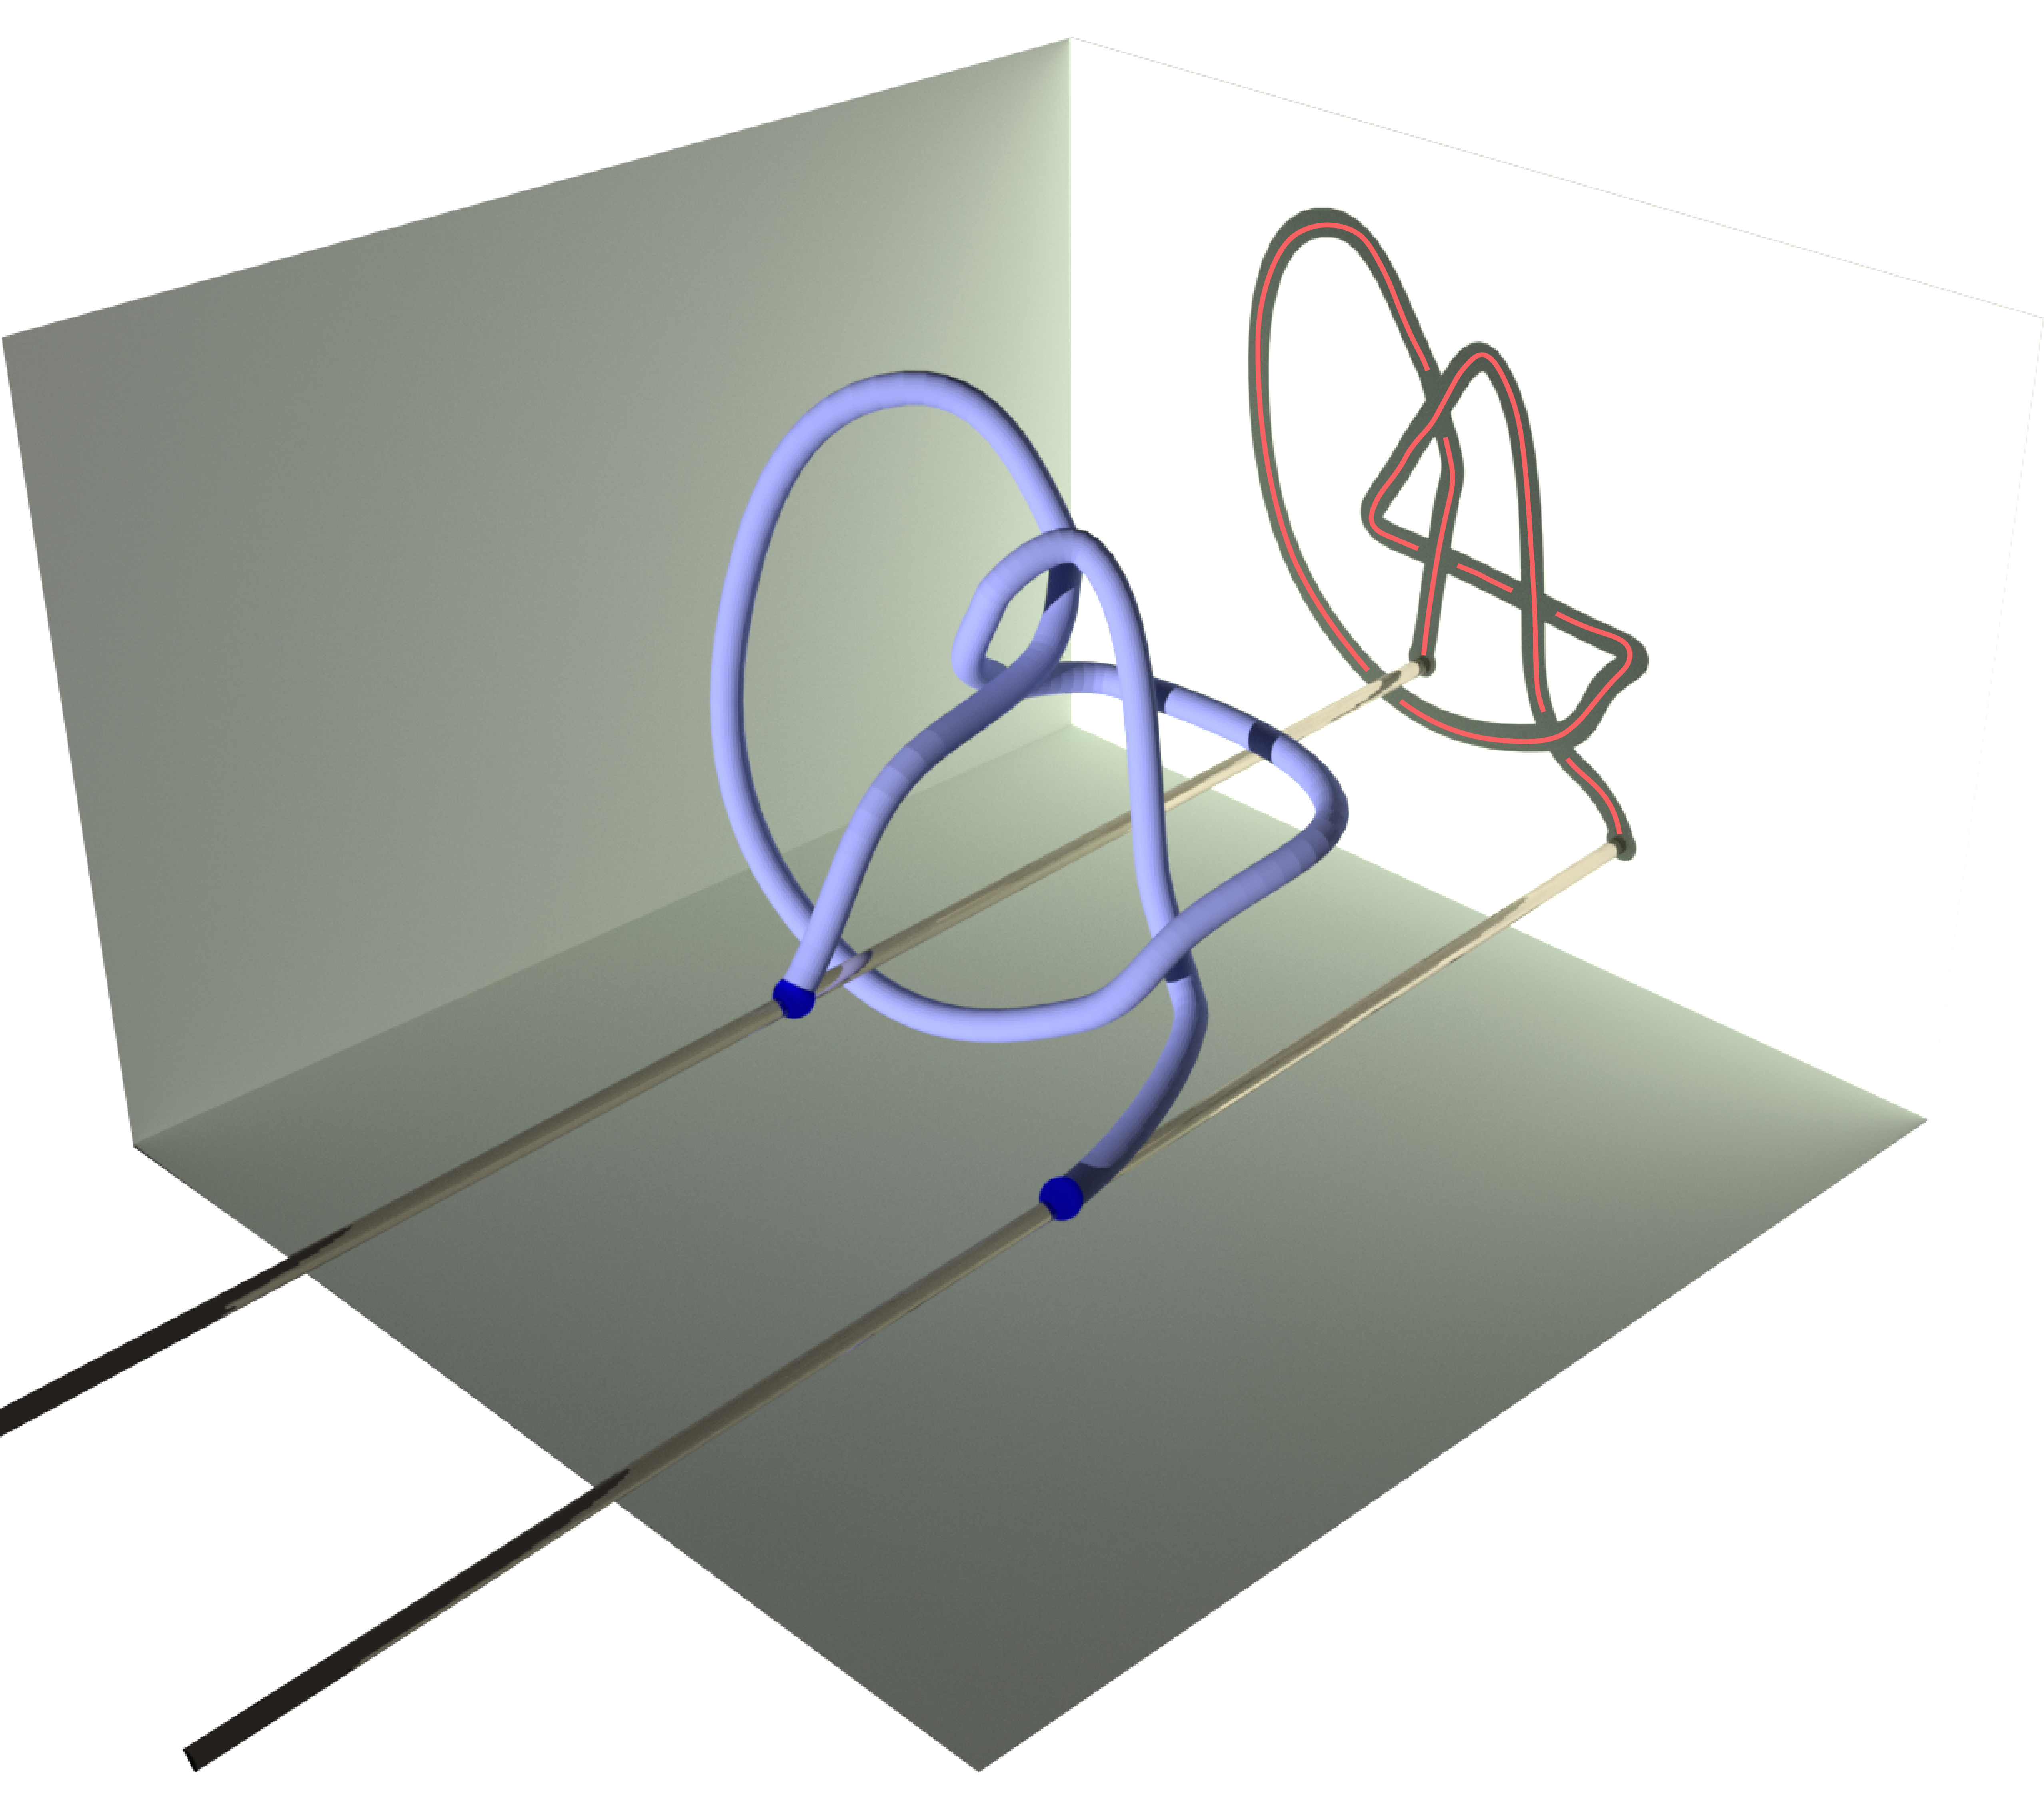
Fig 2. Obtaining a knotoid diagram from a 3D curve.
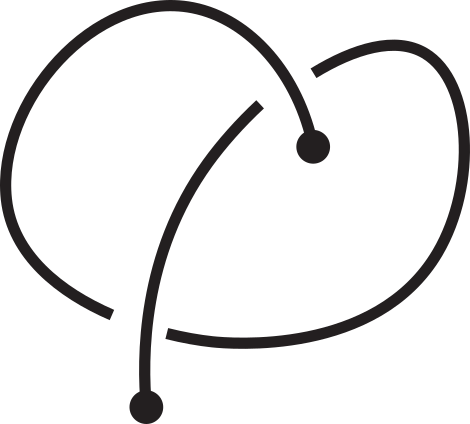
However, this is not enough to characterize the entanglement of the open chain since the knotoid type depends on the choice of the projection plane; different choices may yield different knotoid types (see Fig. 3).
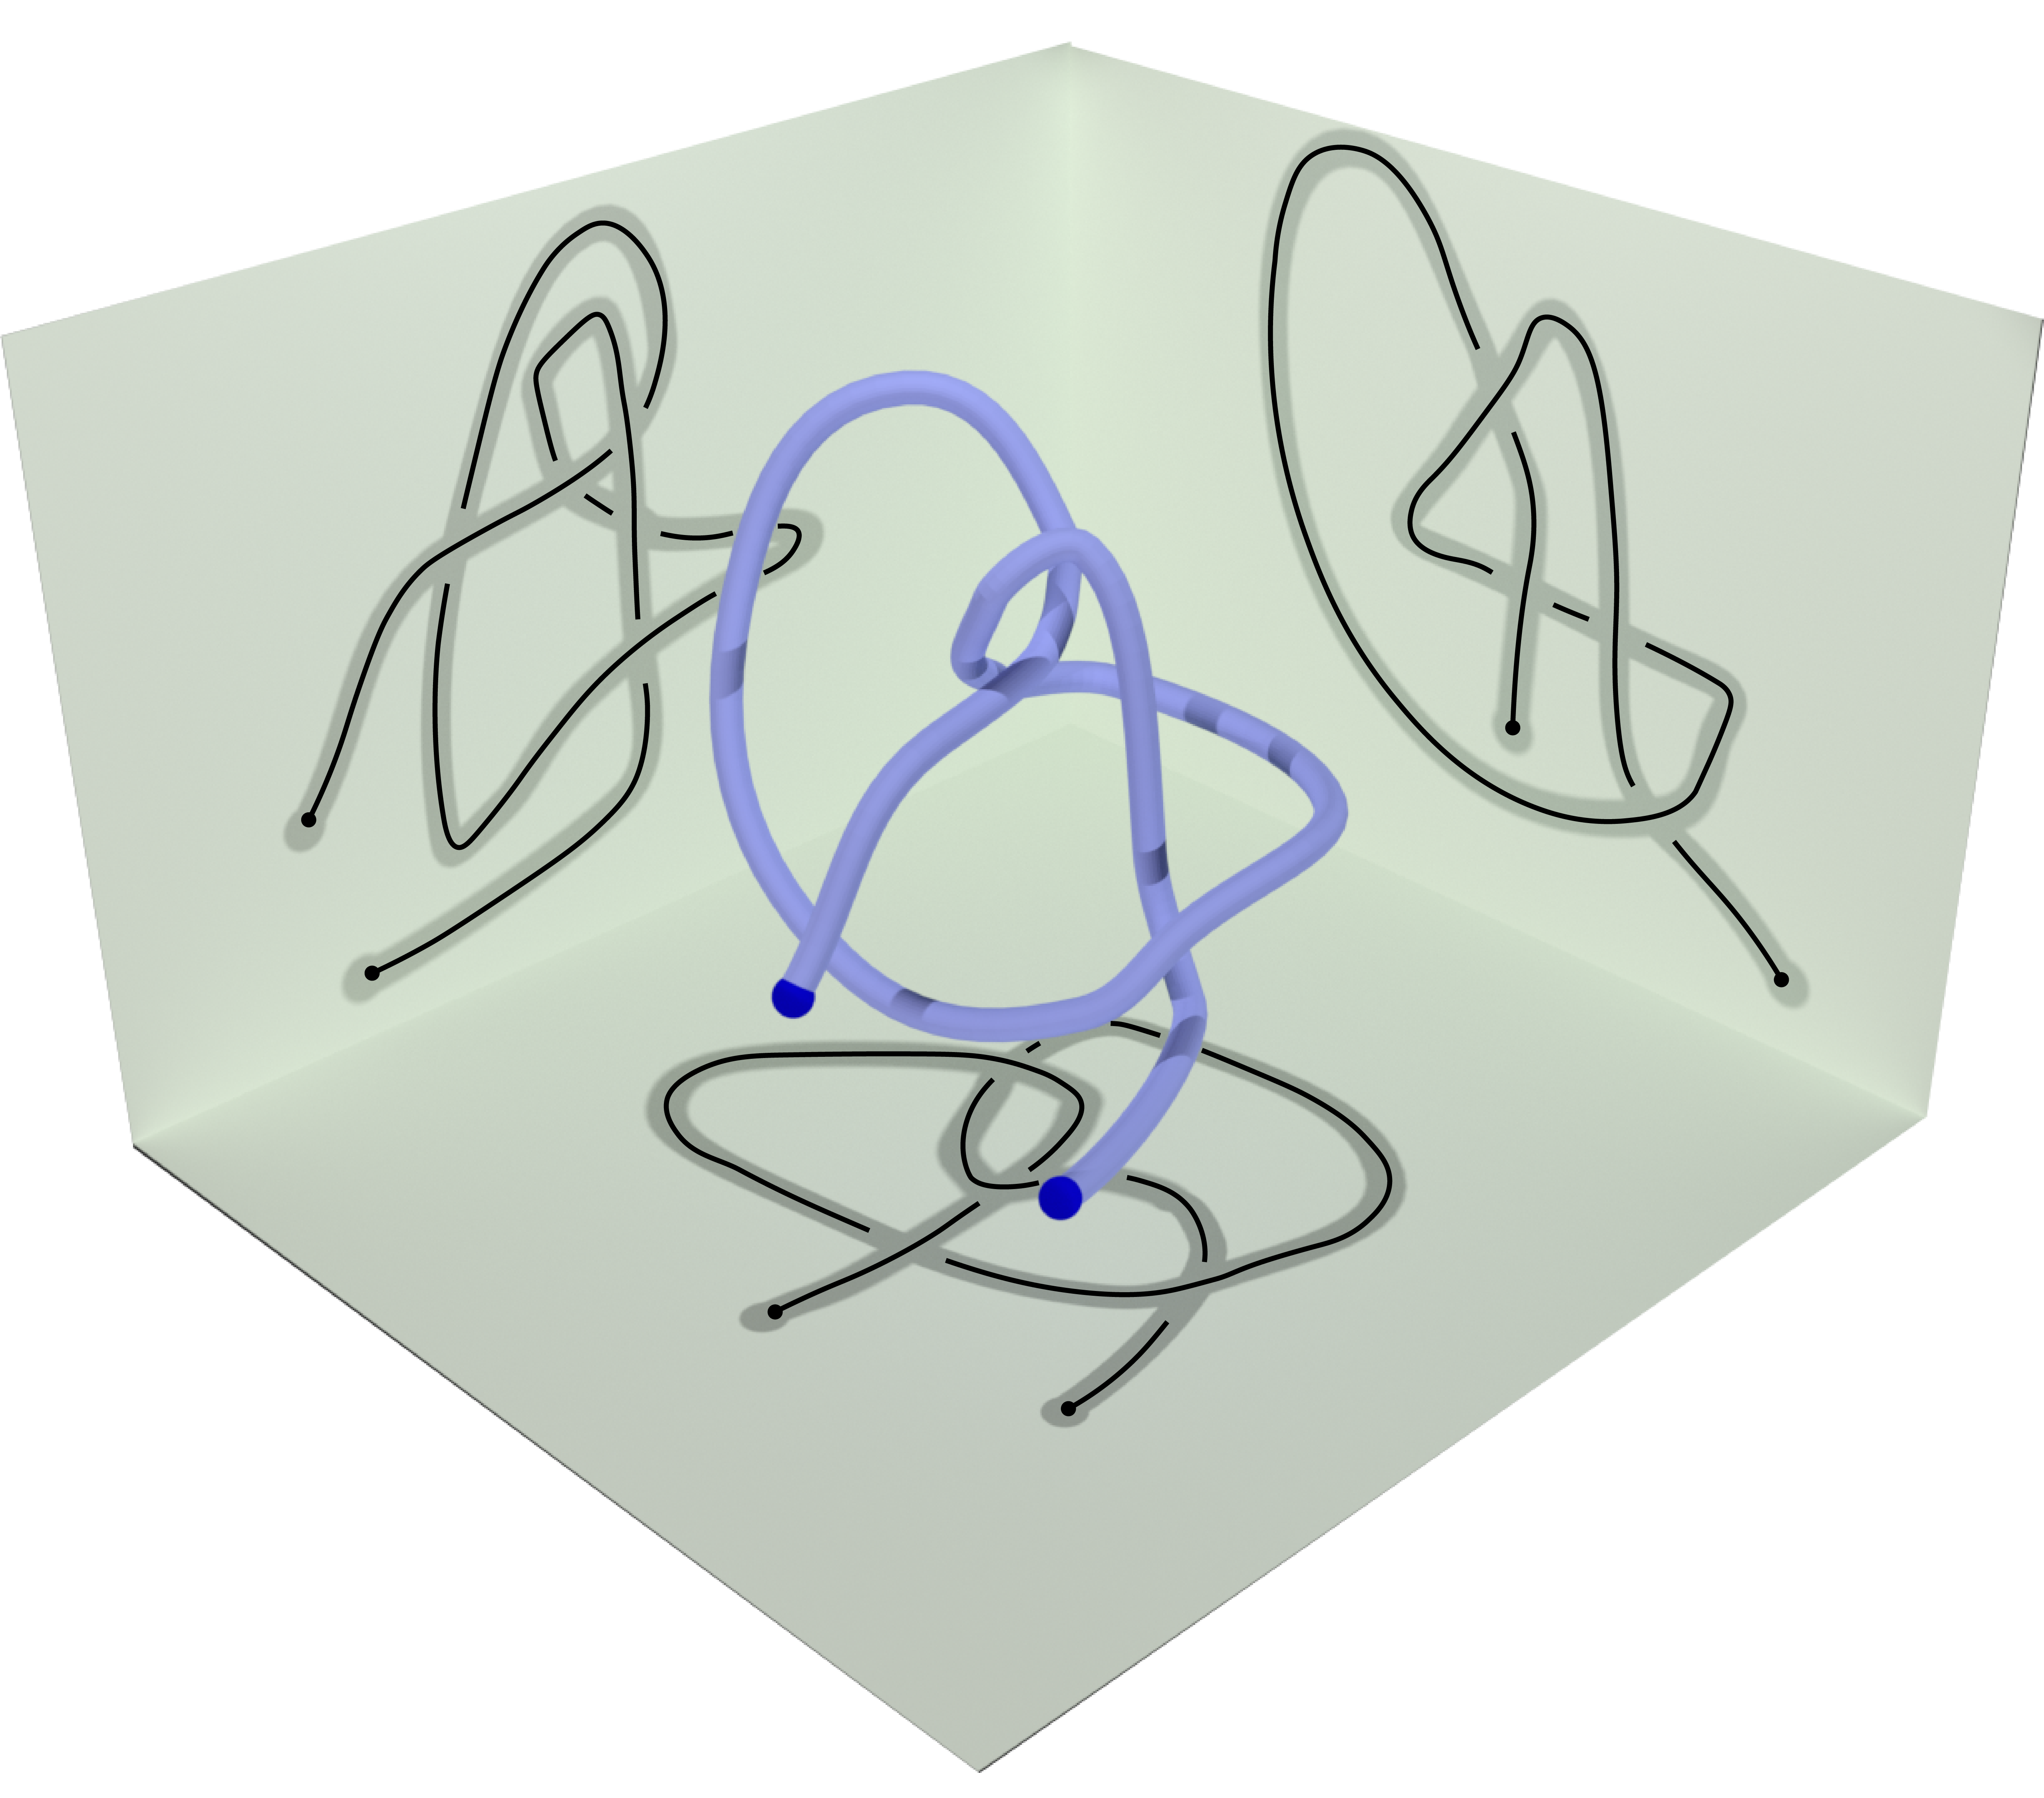
Fig 3. Different knotoids from the same 3D curve.
For this reason, the entanglement of an open chain with the method of knotoids is a probability distribution of knotoid types over all possible projection planes. The knotoid type with the highest probability in the distribution is called dominant and is often used as the representative of the distribution. For practical reasons, a sample of the distribution is usually taken with a size indicated each time by the needs of the analysis. Higher number of projections directions improve precision but make the computations much slower. Here we use 100 projections equisampling the sphere.
Knotoids were successfully introduced to the study the knotted proteins in [3]. Moreover, in [4] it was shown that planar knotoids provide a more detailed overview of the topology of an open chain compared to knotoids on the sphere.
The knotoid types that are obtained from the various projections are determined by knotoid invariants. In this work we use the Turaev loop bracket polynomial [1,3] since we use planar knotoids in our analysis. In order to shorten the computational time of the Turaev loop bracket, a variation of the KMT algorithm is applied to the chain. More precisely, the algorithm is applied once the projection plane has been chosen and the two infinite lines through the endpoints are introduced. At each step the algorithm is applied with respect to the two infinite lines.
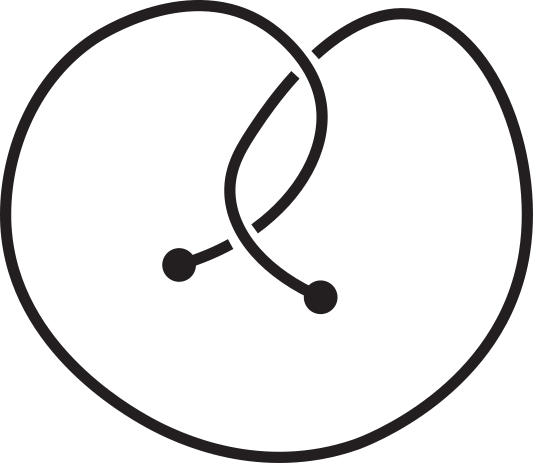
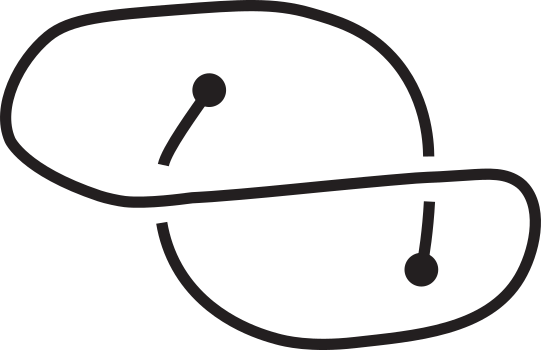
The mirror reflection of a knotoid diagram, denoted by "m", is the same
diagram but with all crossings inverted. For example, in the following figure, the original
diagram is on the left. It is the first knotoid with two crossings and it is denoted by k2.1.
Its mirror reflection, denoted by k2.1m, is depicted on the right where every crossing have
been switched, namely every overpassing has been changed to an underpassing and vice versa.
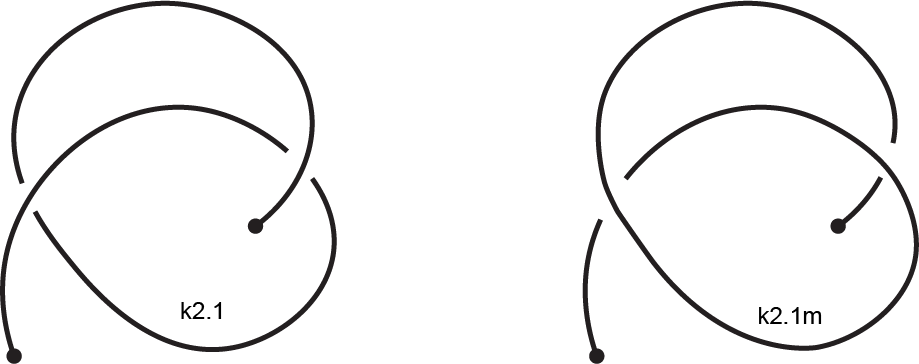
Fig 4. An example of a knotoid and its mirror reflection.
There are two types of visualization of the topology of an open chain: the projection globes/maps that present the data for the global topology and the fingerprint matrices that provide information on the local topology of the chain. The term global topology refers to the topology of the whole chain while the term local topology refers to the topology of each individual subchain of the open chain. Fingerprint matrices provide also information on possible slipknotting that may appear in the conformation and allows the determination of knotted cores.
Projection globes/maps: Projection globes are spheres whose surface contains a varied number of colour-coded regions. Distinct regions with a specific colour correspond to choices of projection directions that yield the same knotoid type. This correspondence is always shown on an accompanying identification scheme. Often the dominant knotoid type can be easily identified since it corresponds to the region that occupies the largest area of the surface of the sphere.
Fingerprint matrices: Open chains are considered as polygonal curves whose vertices are indexed in an ascending order. Fingerprint matrices are square matrices where typically the x axis corresponds to the starting index of the subchain and the y axis to the ending index of the subchain. Since the ending index of a subchain is always greater than the starting index, the upper part of the matrix is empty giving the final matrix a triangular shape. When fingerprint matrices are used in protein analysis the x and y axes correspond respectively to the resid’s of the starting amino acid and the ending amino acid of a protein’s subchain. Each entry is additionally colour-coded, carrying the information of the dominant knotoid type of that particular subchain. The correspondence between colours and knotoid types is always indicated in a provided colour scheme. The whole chain corresponds to the lower left part of the matrix.
Downloadable fingerprint matrices: The downloadable matrices were generated using Knoto-ID [5]. In these matrices the search path that was followed in order to determine the knotted core of the dominant knotoid for the full chain as well as the knotted core itself are additionally presented. The search path is indicated by a blue line in the matrix. Starting from index 0, the length of the chain is progressively altered by 1 vertex each time while, at the same time, attention is given so that the knotoid type of the chain doesn’t change. If after one step the knotoid type is indeed changed, the algorithm backtracks to the previous position, trims a vertex from the start of the chain and adds one to the end. This procedure is repeated until the shortest chain that can maintain the dominant knotoid type is determined and it is marked with a yellow circle on the matrix. Note that there could be multiple chains of the smallest length and they are all indicated on the matrix.
A recent (2018) major extension of the Knotprot Server and Database
added Knotoids and Cystein Knots.
The calculation of knotoids using the
Knoto-ID
package is a multistage process that, in particular, for larger
proteins takes a significant amount of time to compute. The computing
of knotoids may last anywhere from minutes to several weeks for a
single protein chain. The Knotprot database at the moment when this
project was undertaken included over 2000 proteins, therefore the
SORCER Modeling Framework (SMF) was applied to help accelerate the
computing process. Although,
SORCER
and the
SORCER
Modeling Framework were initially designed for
use in engineering, in particular, in Trans- and Multidisciplinary
Design Optimization (MDO), this platform can be easily adapted to
serve in any distributed computing application. In this case, the SMF
was used to integrate the Knoto-ID solvers and post-processing
scripts and distribute the computations across a network of desktops
and clusters.
More on SORCER Modeling Framework:
Sobolewski M (2014) A Service-Oriented Computing Platform: An Architecture Case Study. Handbook of Research on Architectural Trends in Service-Driven Computing, IGI Global, 220-255.
Rubach P, Sobolewski M (2009) Dynamic SLA Negotiation in Autonomic Federated Environments. In: Meersman R., Herrero P., Dillon T. (eds) On the Move to Meaningful Internet Systems: OTM 2009 Workshops. OTM 2009. Lecture Notes in Computer Science, vol 5872. Springer, Berlin, Heidelberg.
Kolonay RM (2013) Physics-Based Distributed Collaborative Design for Aerospace Vehicle Development and Technology Assessment. In 20th ISPE International Conference on Concurrent Engineering. IOS Press. 198-215
Abramowicz M, Kamieniecki K, Piechna A, Rubach P, Piechna J (2015) Using ANSYS and SORCER Modeling Framework for the Optimization of the Design of a Flapping Wing Bionic Object. Machine Dynamics Research, 39, 1
[1] Turaev V (2012)
Knotoids, Osaka J. Math., 49, 195–223.
[2] Gügümcü N, Kauffman LH (2017)
New invariants of knotoids, Eur. J. Comb. 65, 186-229.
[3] Goundaroulis D, Dorier J, Benedetti F, Stasiak A (2017)
Studies of global and local entanglements of individual protein chains using the concept of knotoids, Scientific Reports, 7, 6309.
[4] Goundaroulis D, Gügümcü N, Lambropoulou S, Dorier J, Stasiak A, Kauffman LH (2017)
Topological Models for Open-Knotted Protein Chains Using the Concepts of Knotoids and Bonded Knotoids, Polymers, 9, 444.
[5] Dorier J, Goundaroulis D, Benedetti F, Stasiak A (2018)
Knoto-ID: a tool to study the entanglement of open protein chains using the concept of knotoids, Bioinformatics, bty365, DOI: 10.1093/bioinformatics/bty365.